
See a real ALEX³ result
This is what you get: a detailed lab report from LabClinic, here generated from a real ALEX³ validation sample. Below we walk through each part in plain English, from total IgE to the last of the 300 values.
The report, part by part
The header and total IgE
Gesamt-IgE Ergebnis
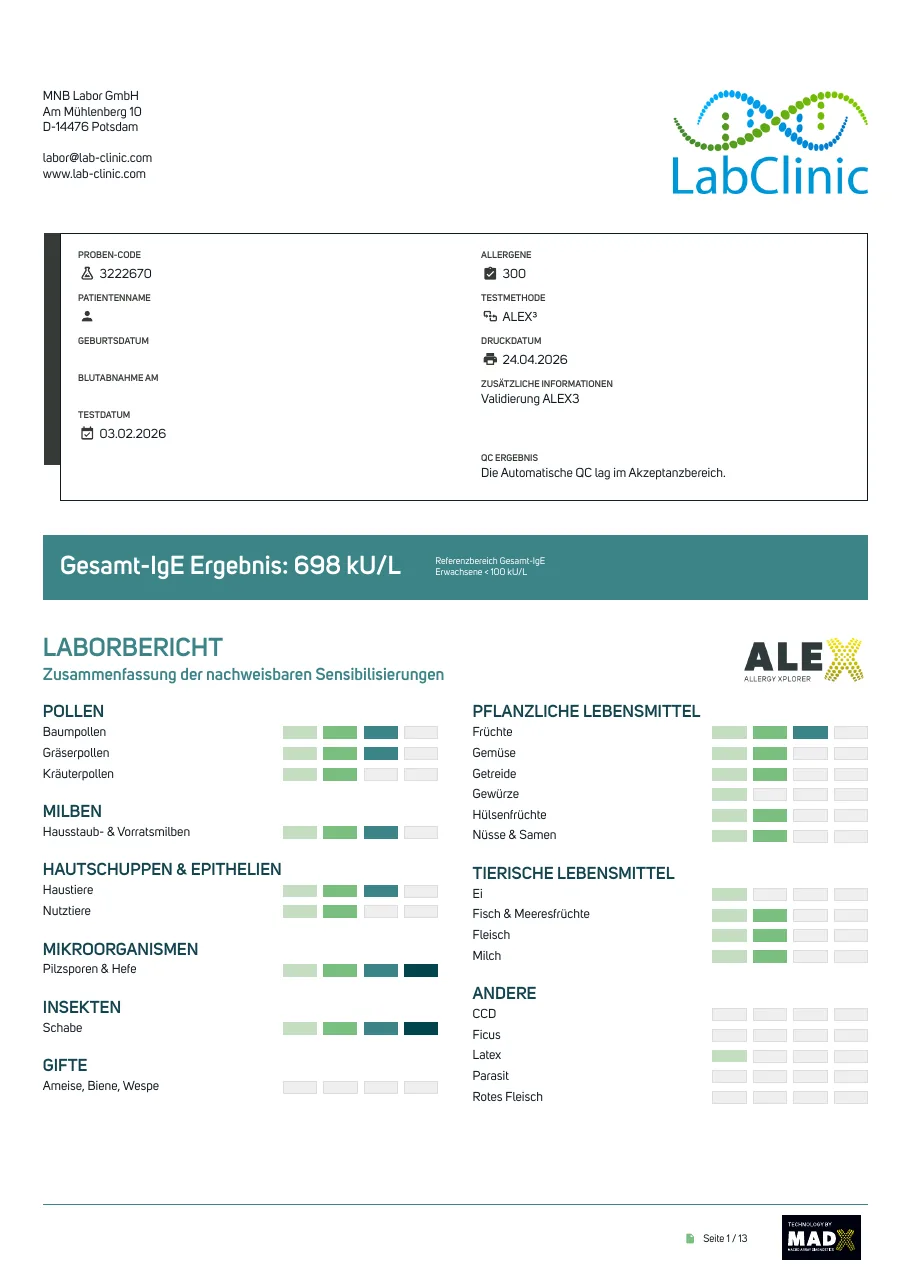
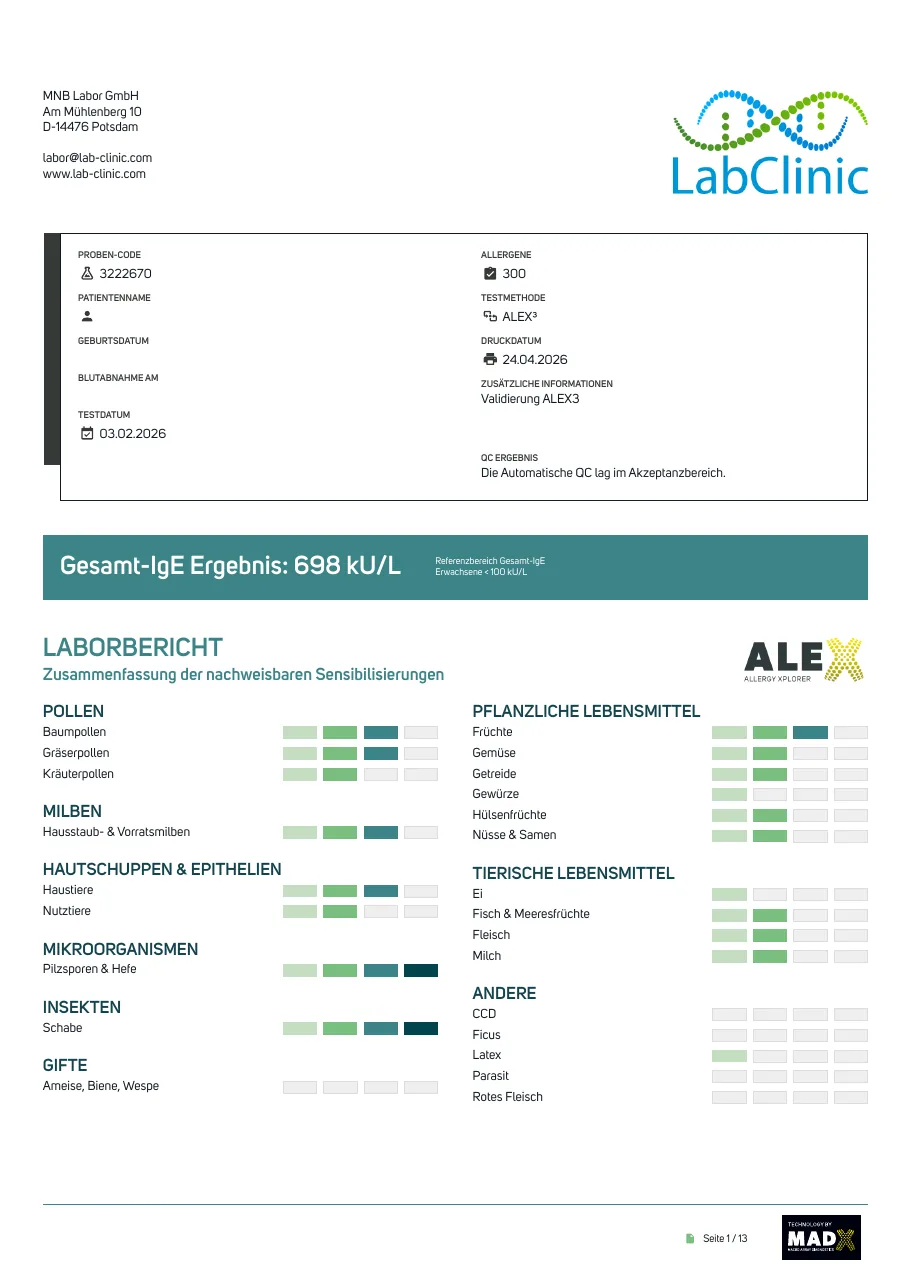
The top of page 1 shows the sample code, the number of allergens tested (300), the method (ALEX³) and the test date. On this sample the patient fields are empty.
The coloured band below it is total IgE: the overall amount of IgE antibodies in the blood, in kU/L. It is not tied to any one allergen. Here it is 698 kU/L, and the lab prints its reference range beside it: below 100 kU/L for adults. A value outside the range is context for a doctor reading the specific results, not a diagnosis on its own.
 (Open full size)
Report page 1
The one-page summary
Zusammenfassung der nachweisbaren Sensibilisierungen
The lower half of page 1 lists every allergen group, such as tree pollen, house dust and storage mites or fruits, with a four-step bar beside it. The bar shows the highest class measured in that group: one step for Low, two for Moderate, three for High, four for Very high. An empty bar means nothing in the group reached 0.3 kUA/L.
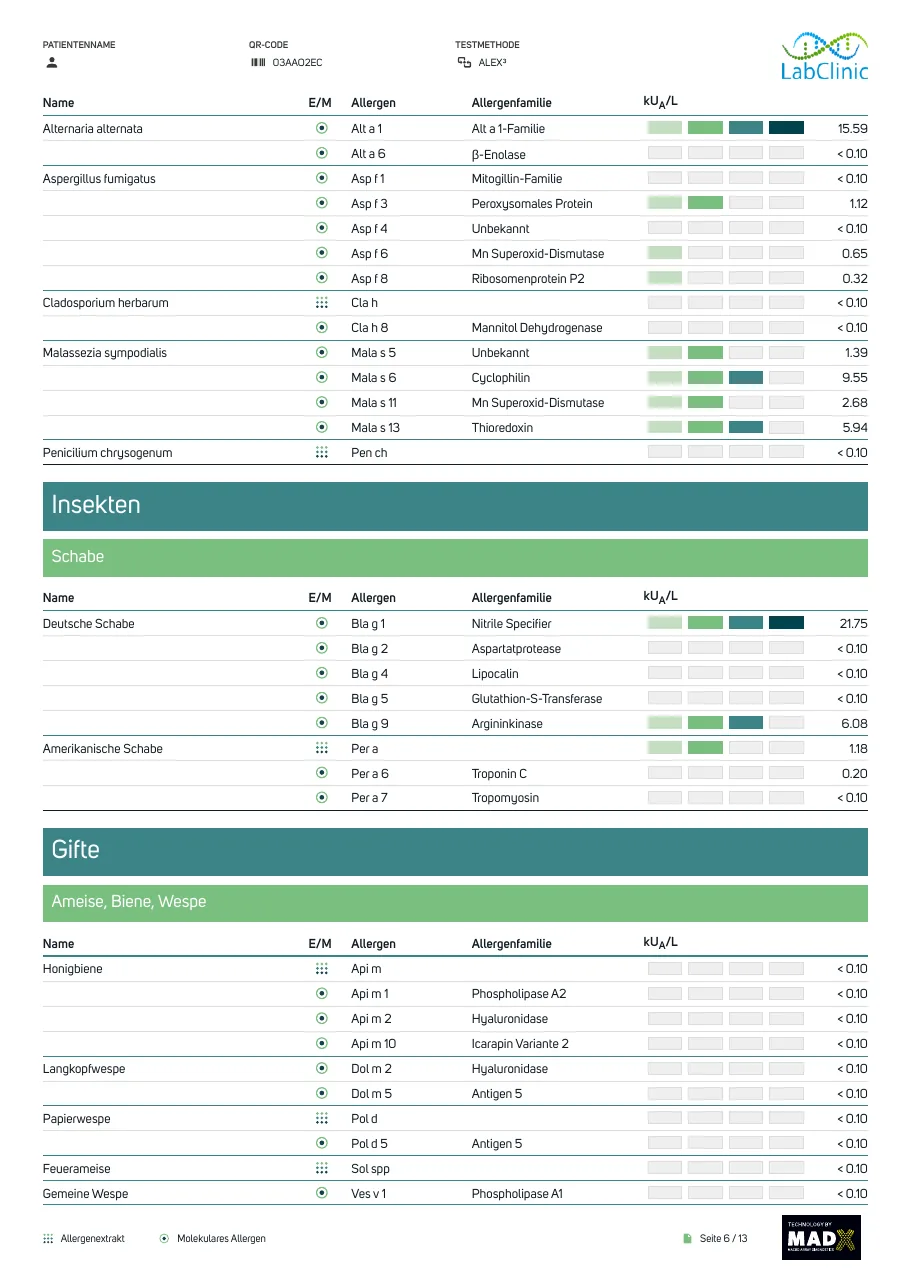
In this sample, cockroach and mould spores reach four steps, tree pollen, grass pollen and mites three, and the venoms stay empty. Think of it as a map that tells you where to look in the detail pages.
Every allergen, one row each
Zusammenfassung aller Ergebnisse
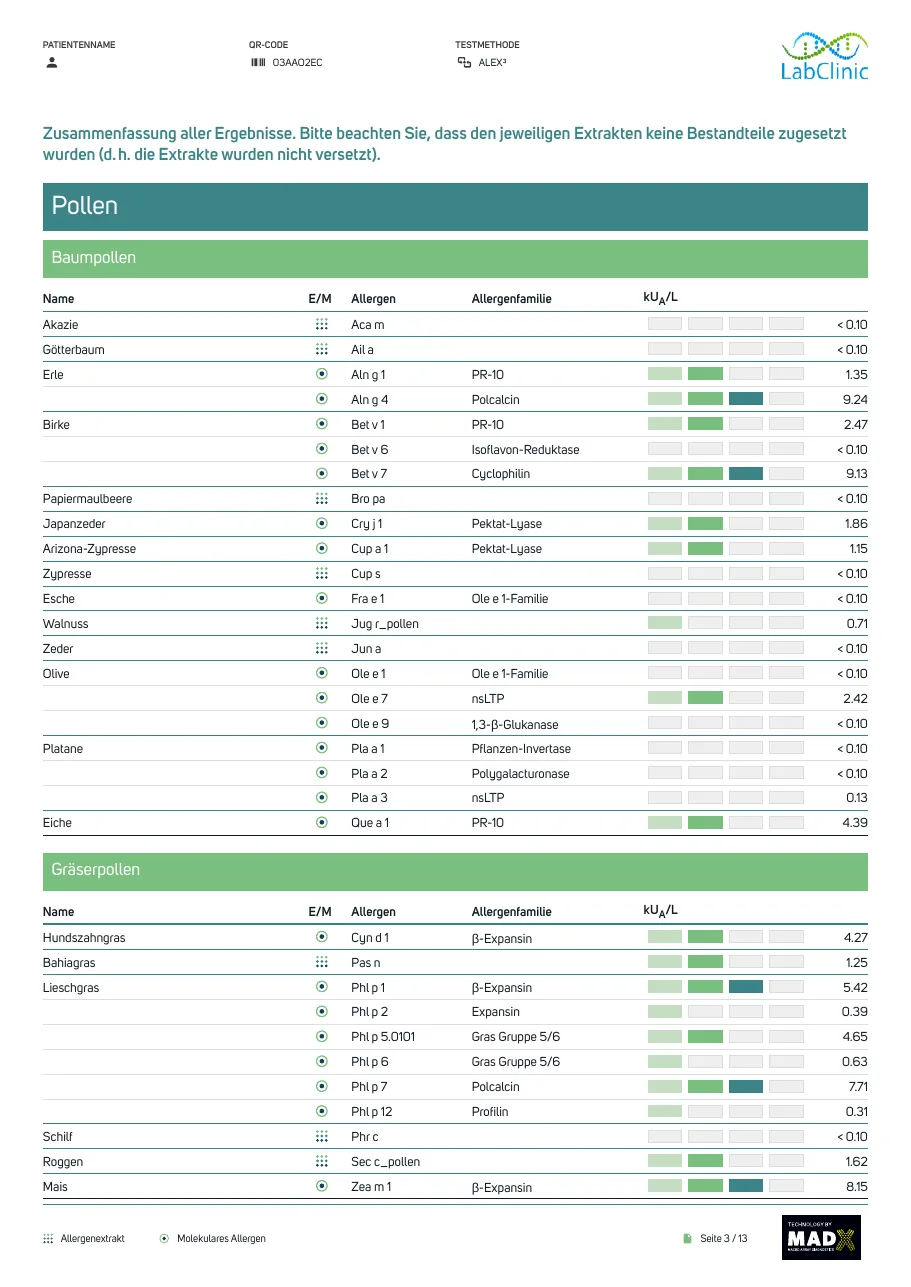
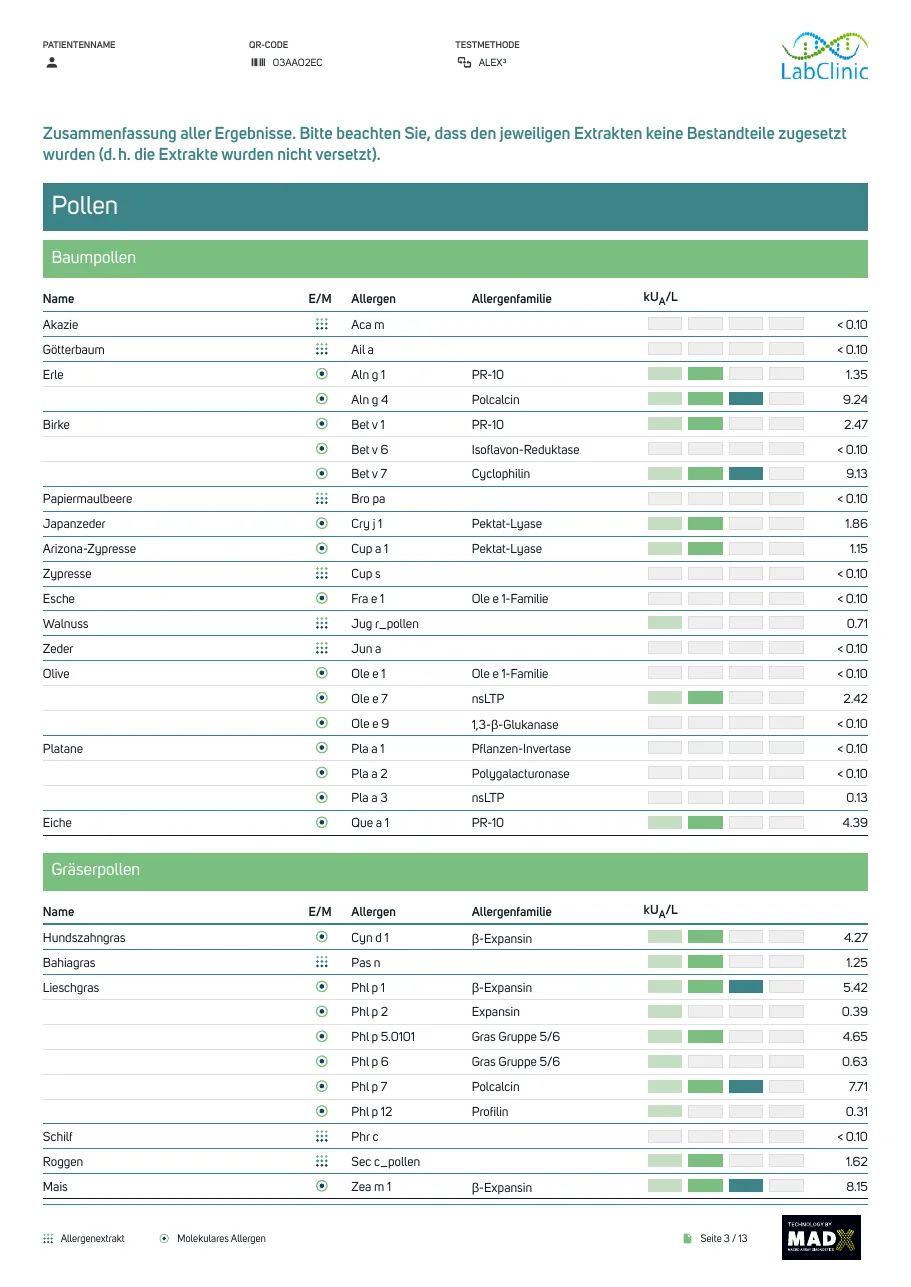
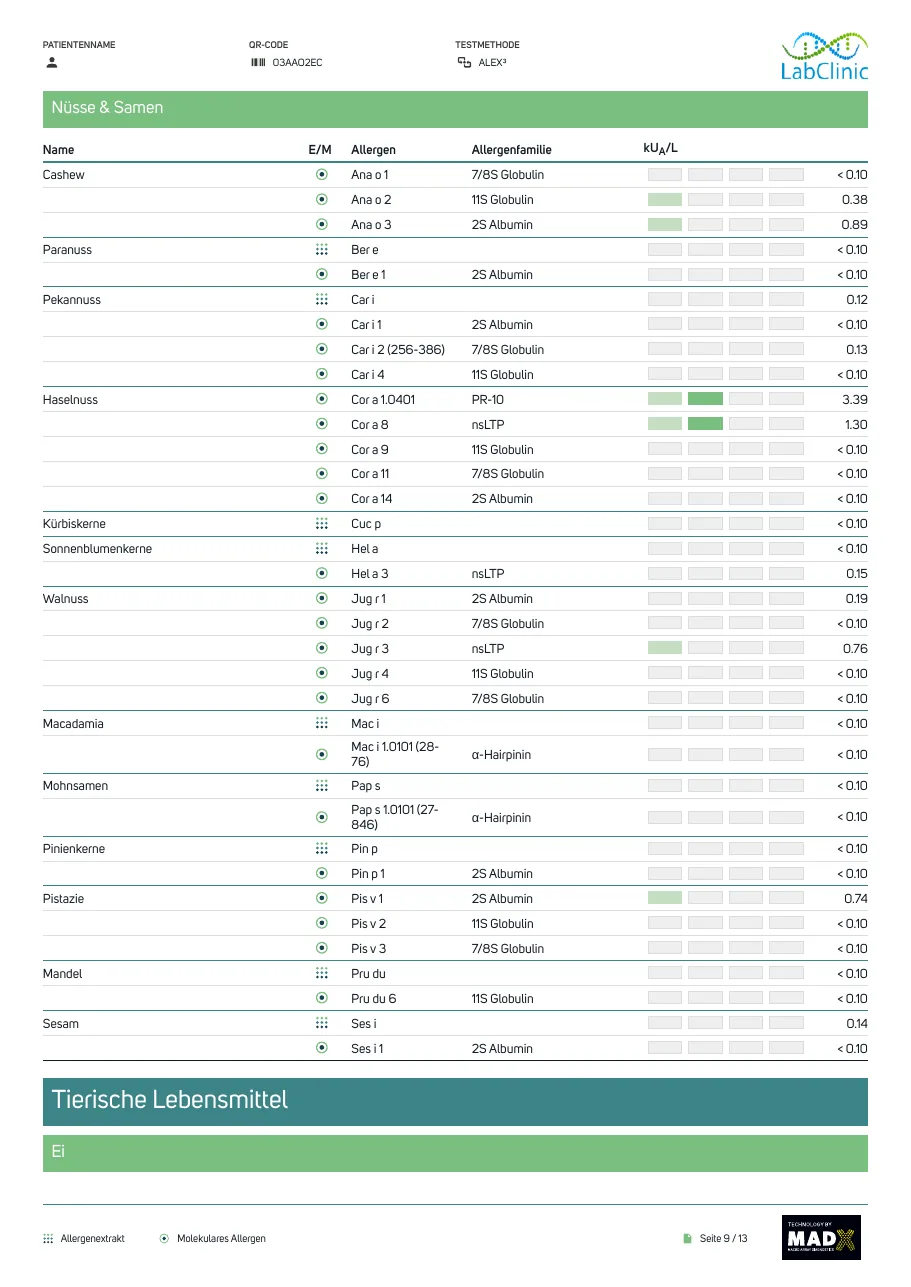
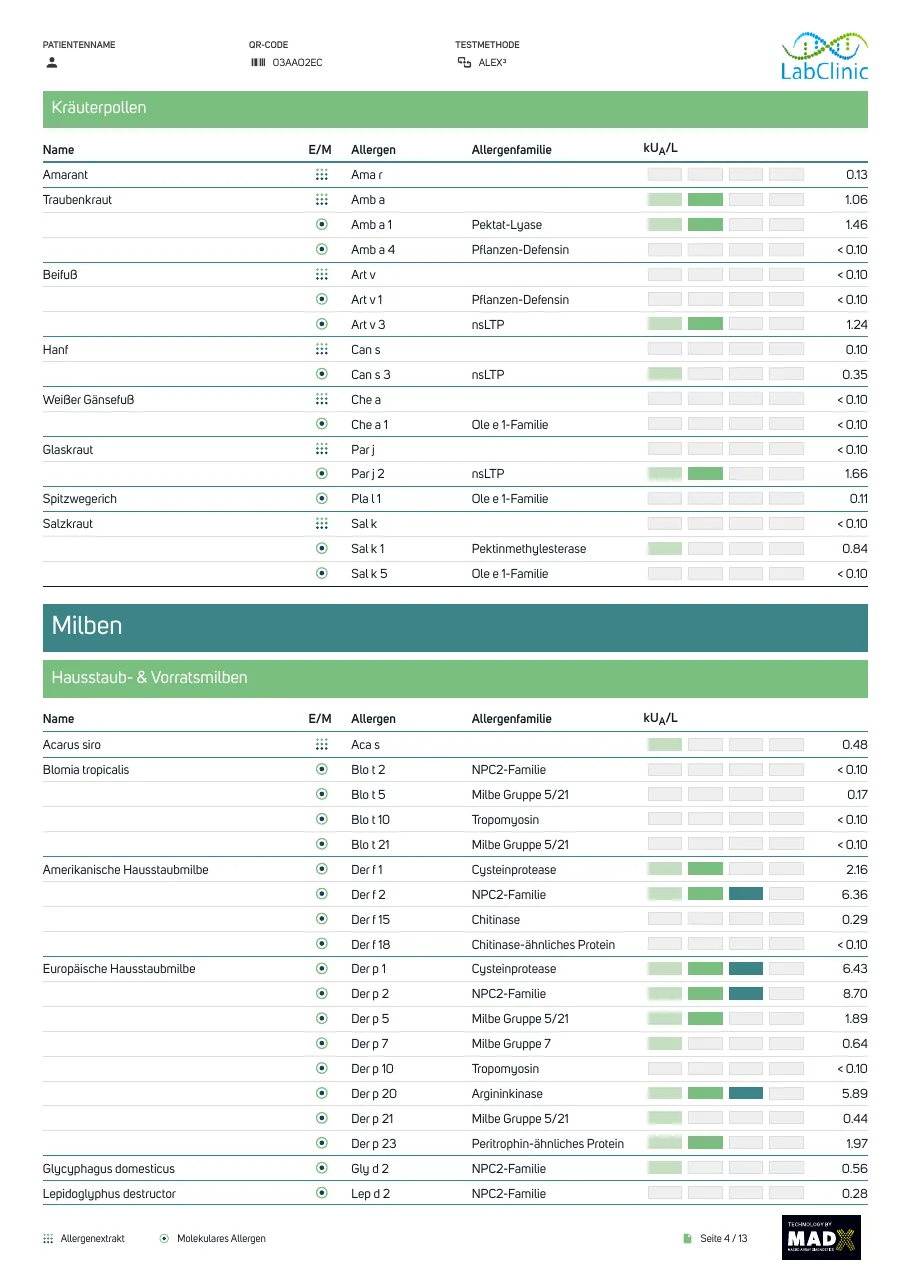
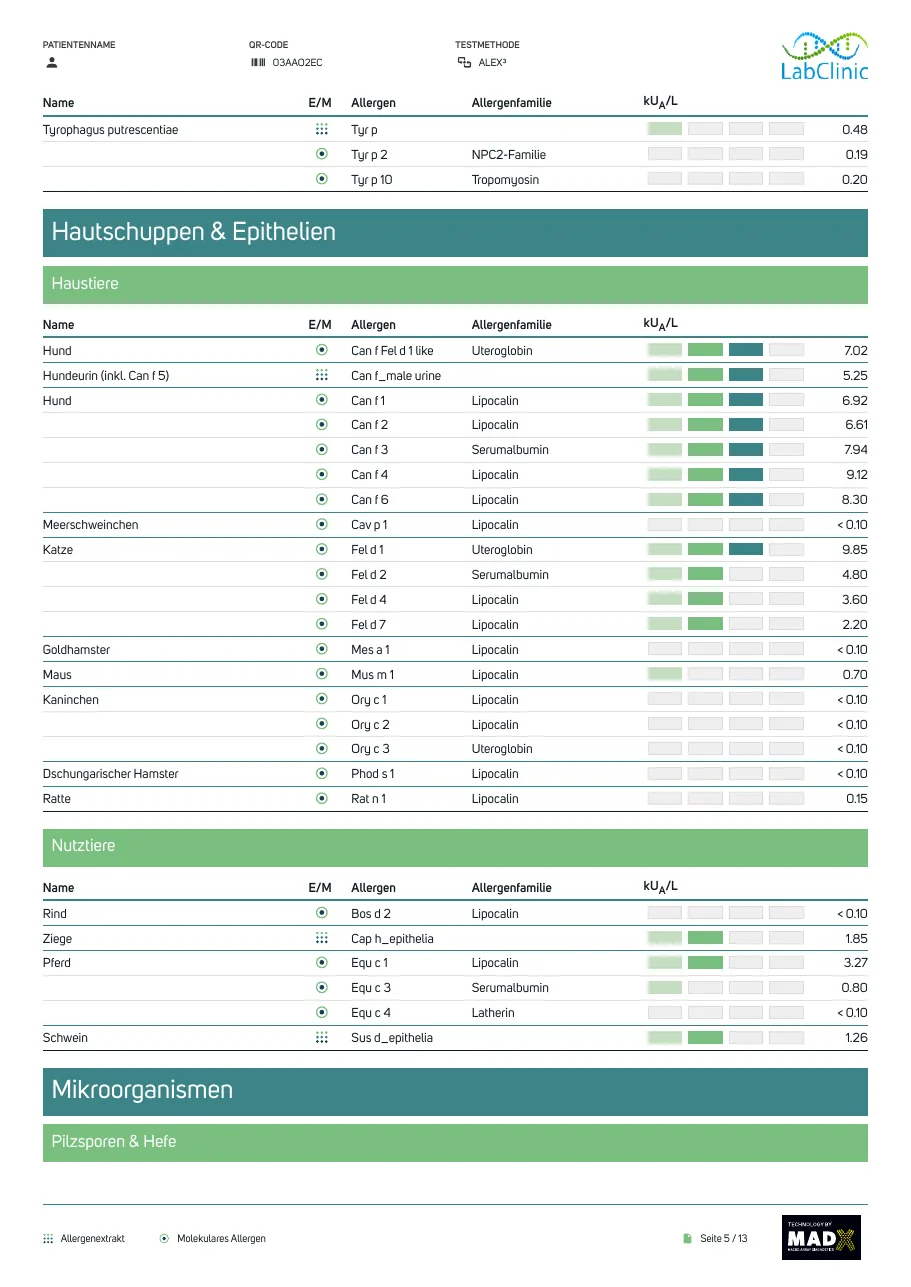
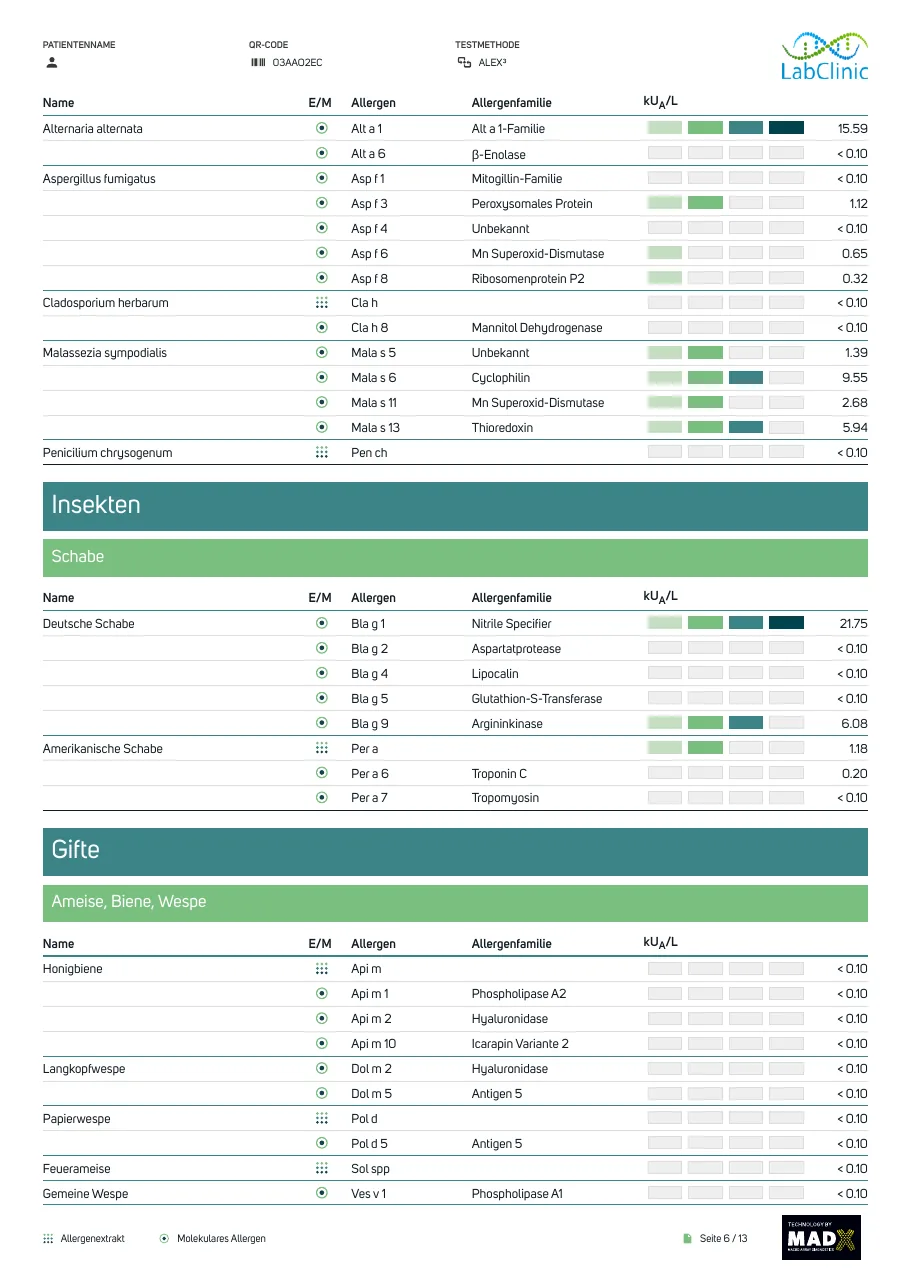
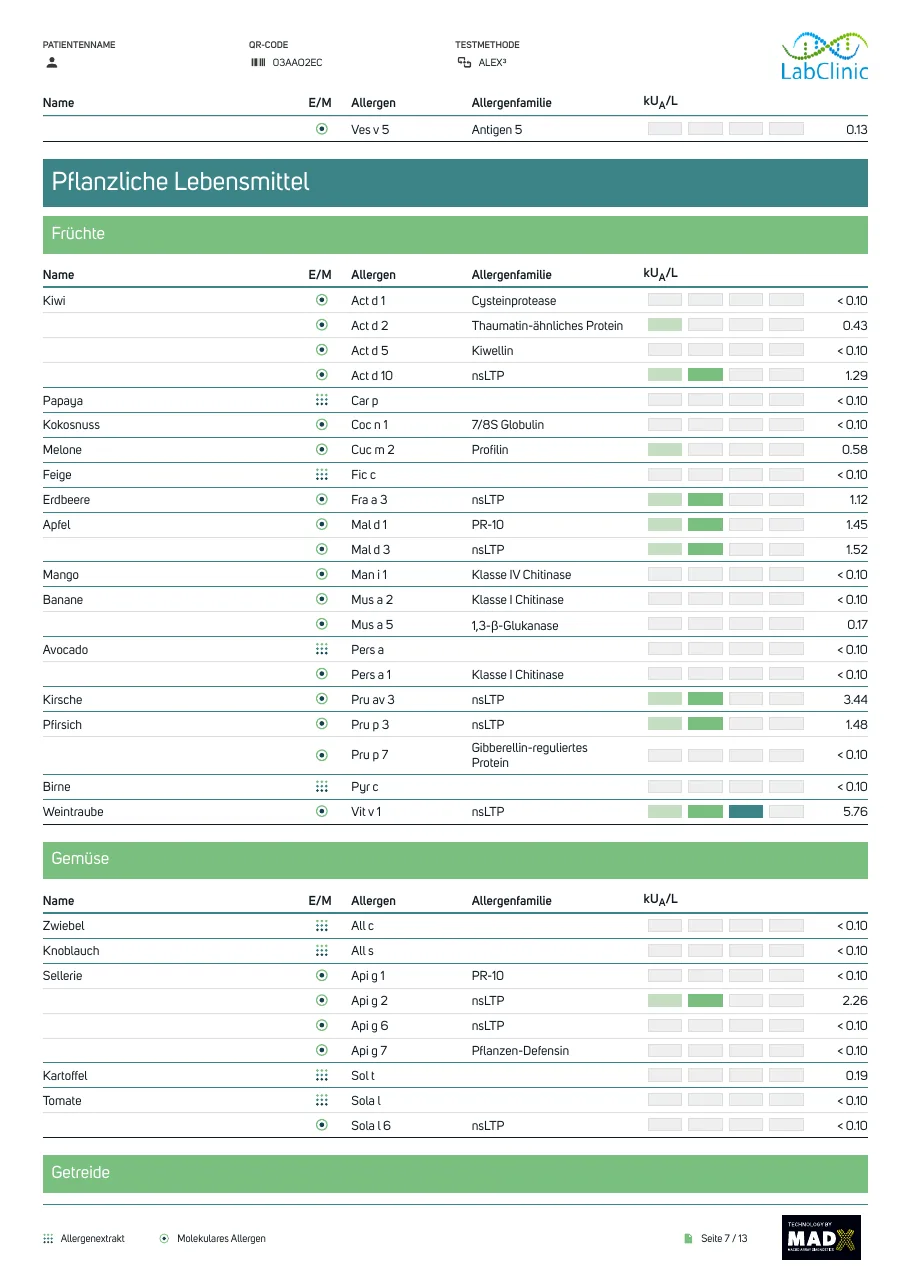
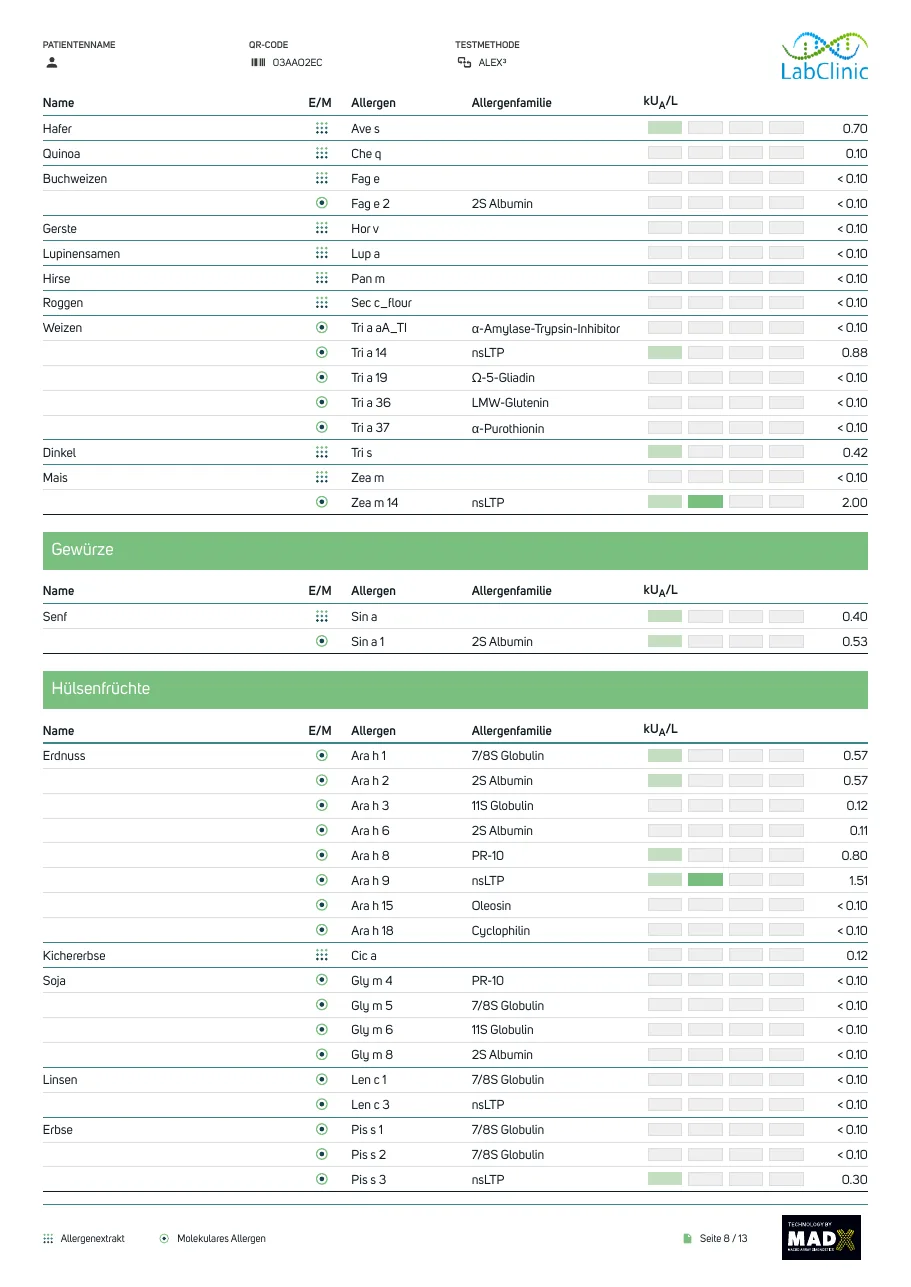
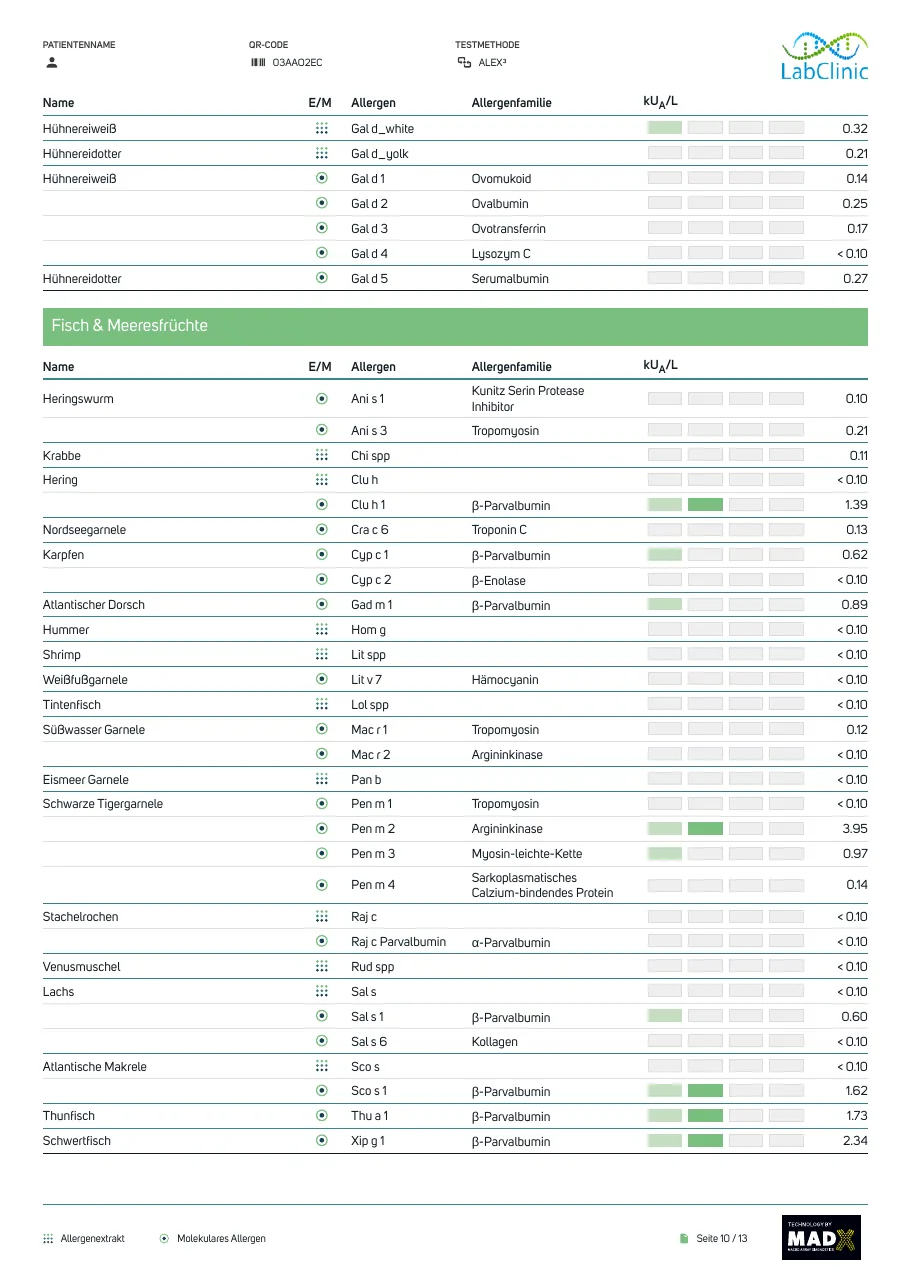
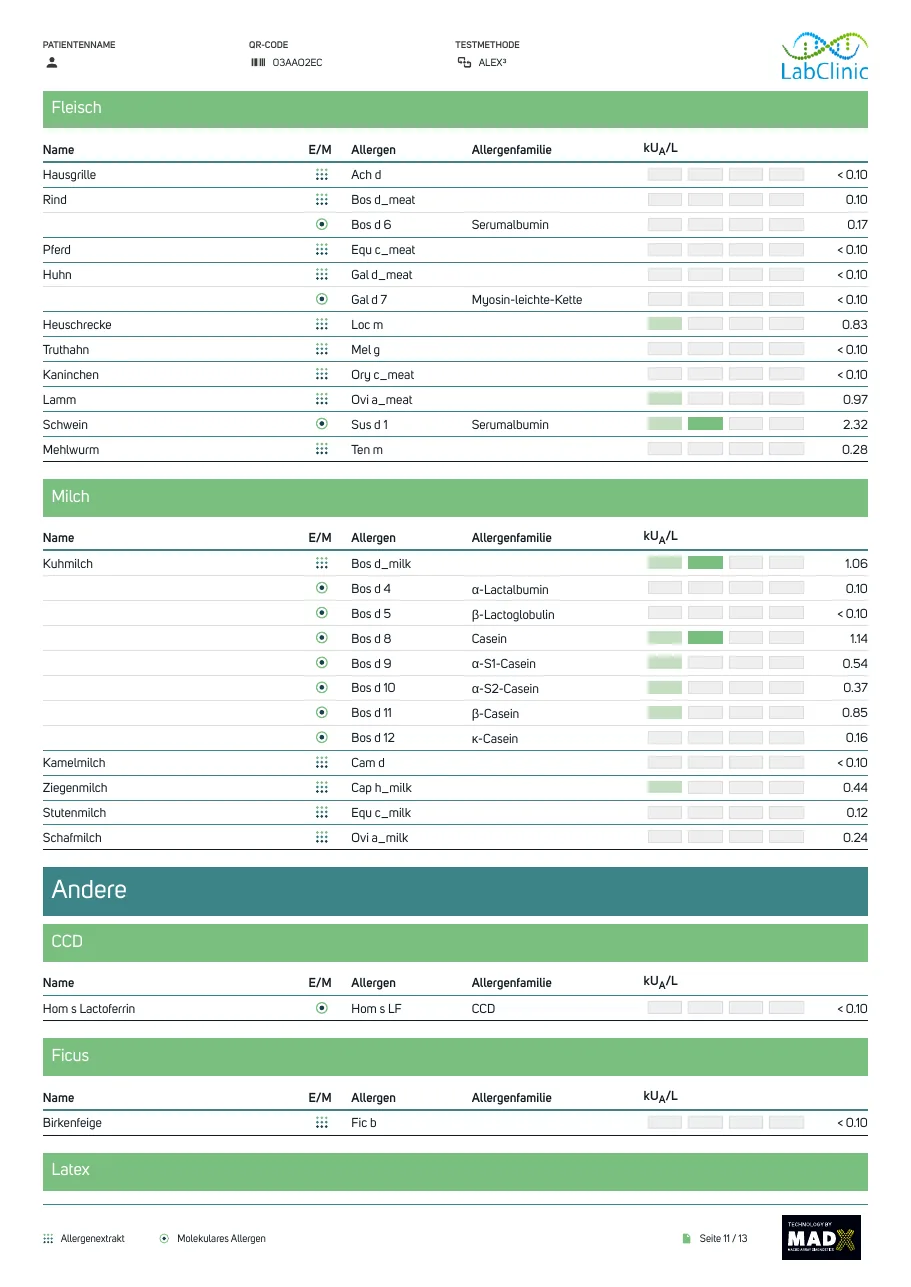
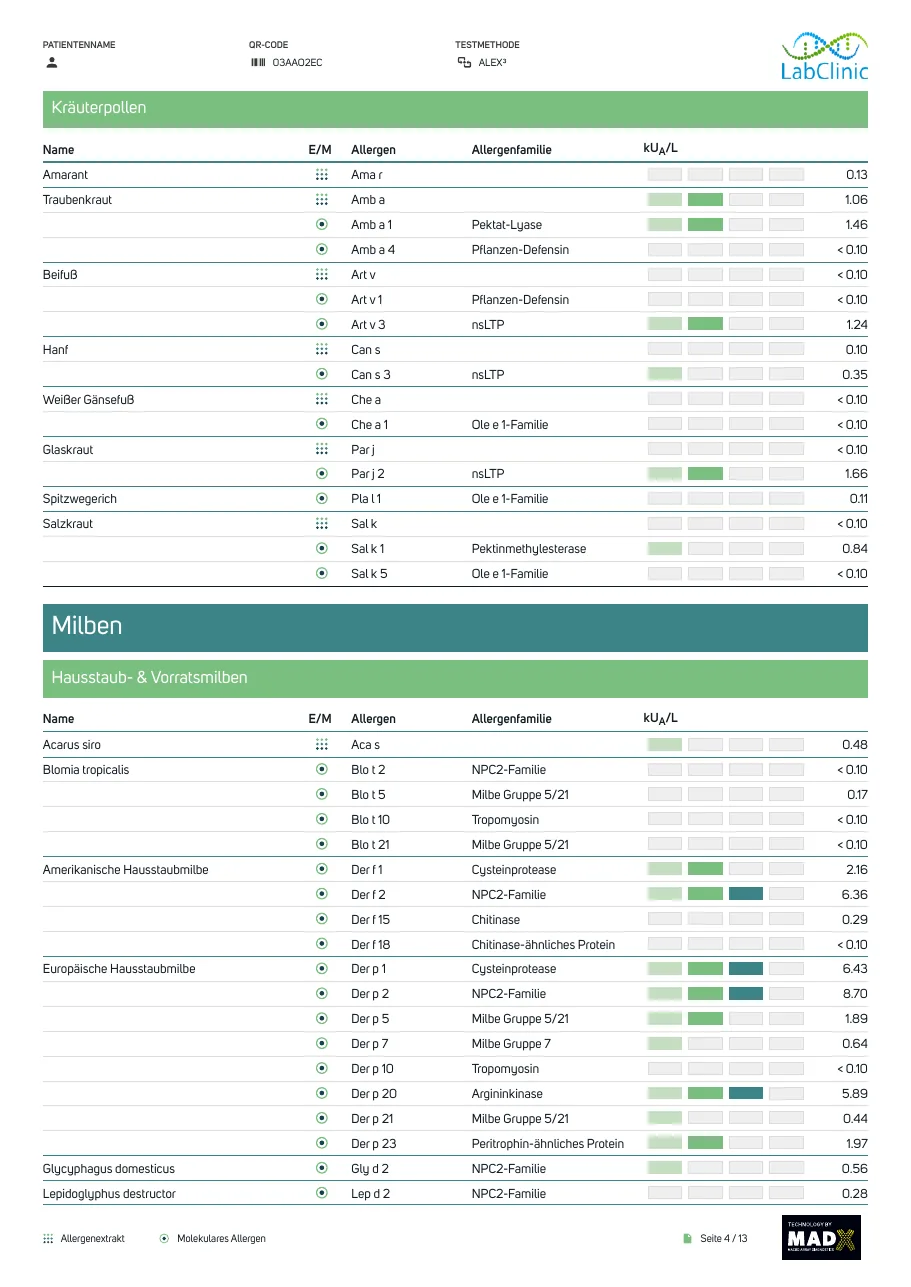
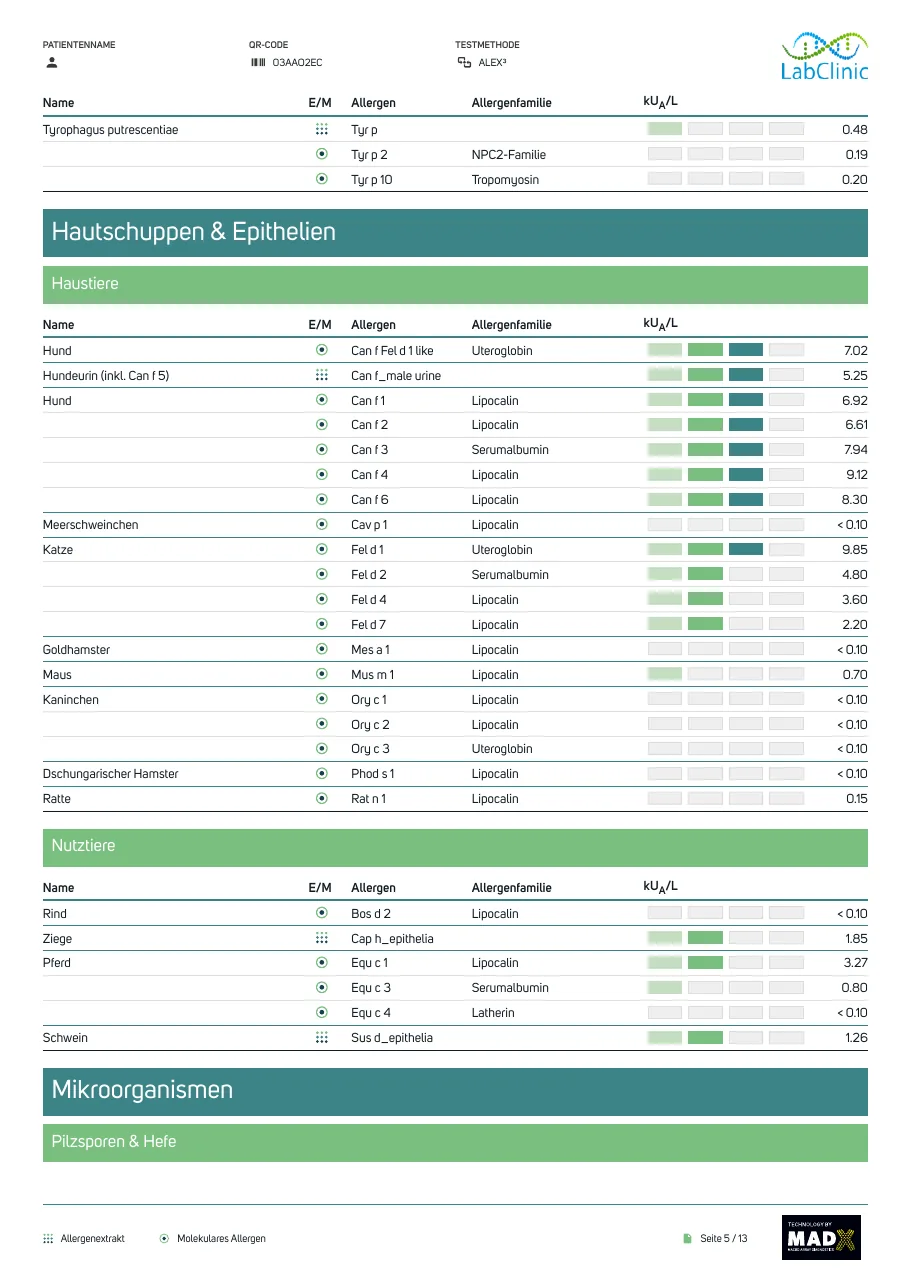
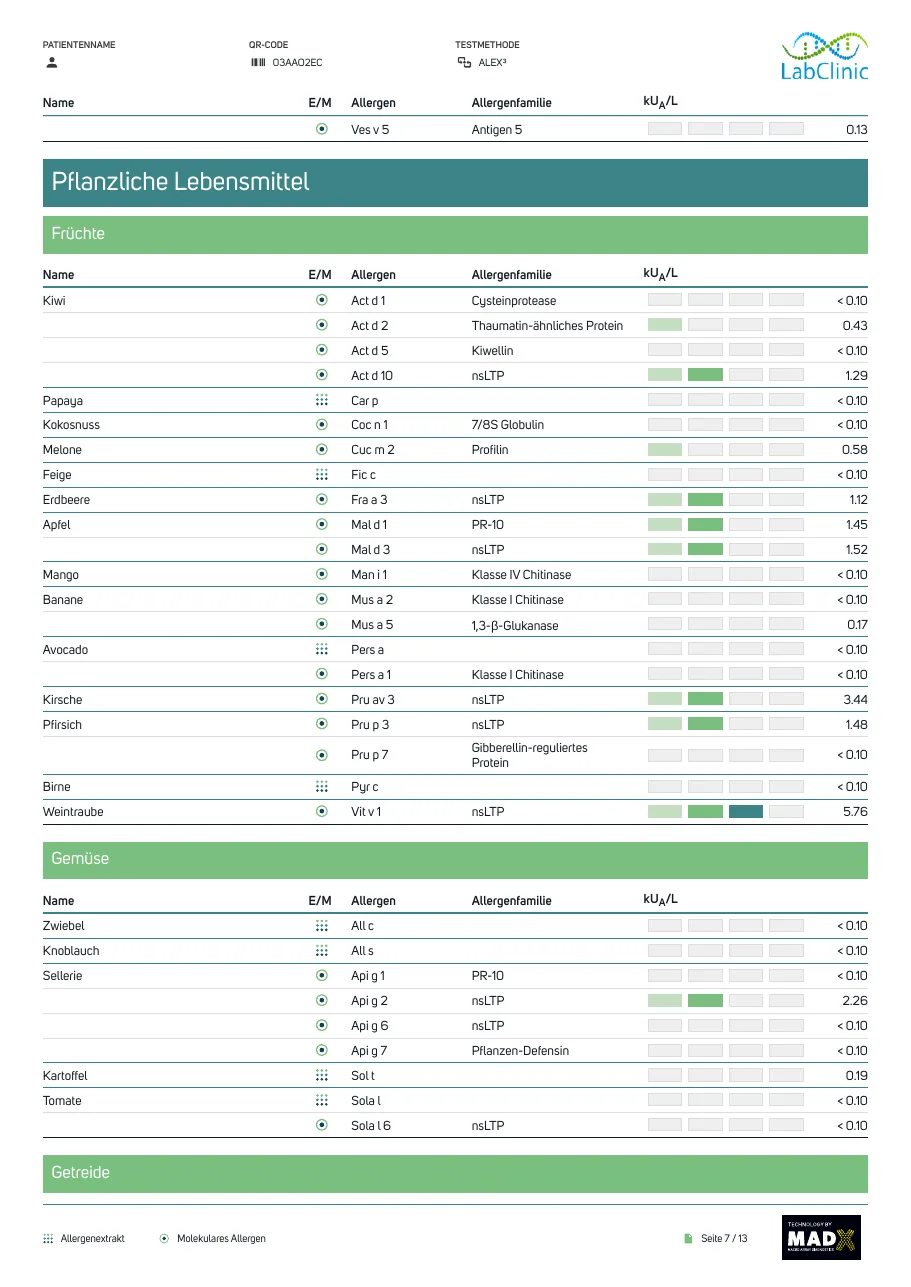
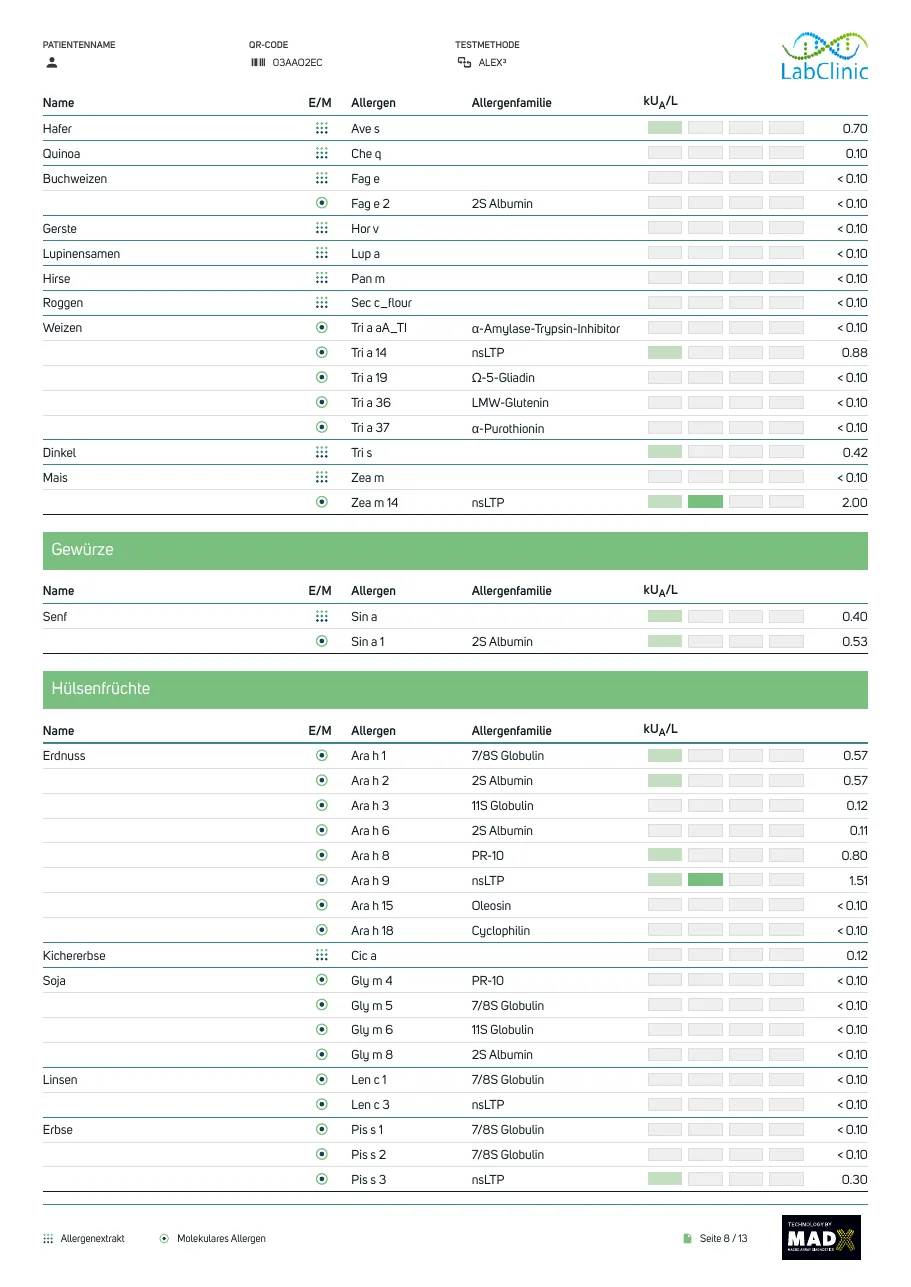
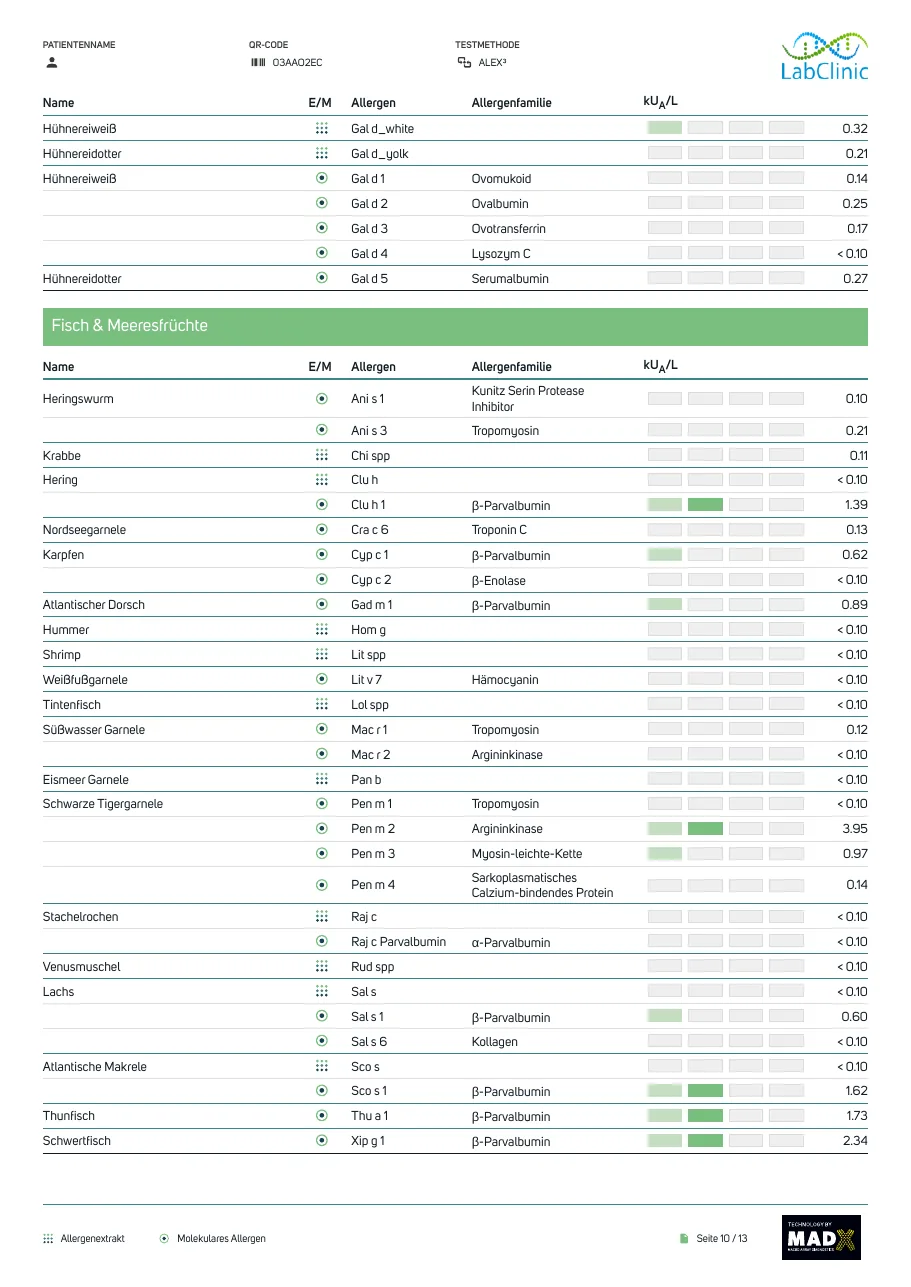
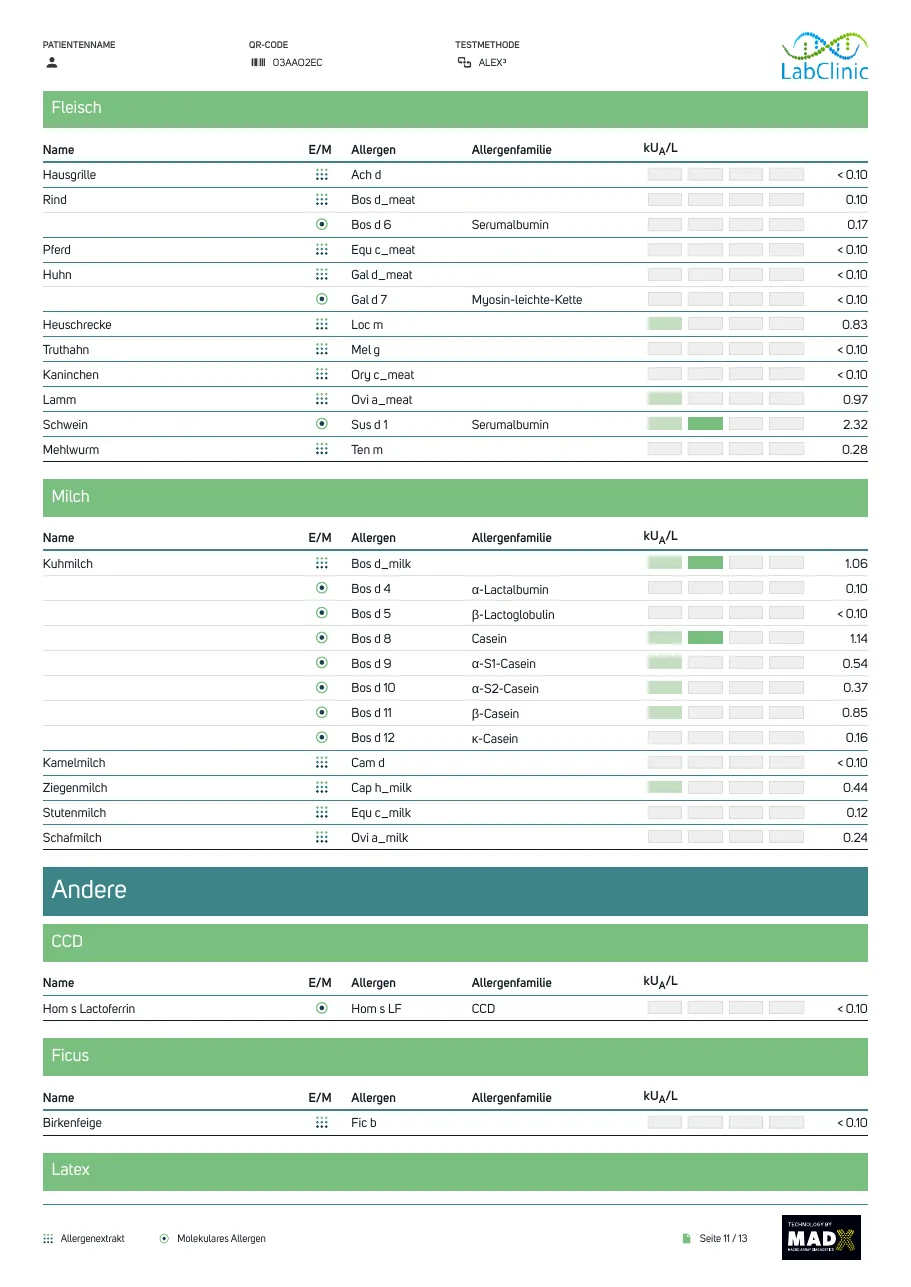
Pages 2 to 11 list all 300 results, grouped like the summary. Each row shows the allergen source (in German), whether it is an extract or a molecular component (E/M), the allergen code, its protein family and the measured value in kUA/L, with the same four-step bar.
For example: Birke (birch), molecular component, Bet v 1, PR-10, 2.47 kUA/L. Two steps, so Moderate.
 (Open full size)
Report page 2
Extract or molecular component
Allergenextrakt, Molekulares Allergen
A small grid of dots in the E/M column marks an allergen extract: the whole mix of proteins from one source, such as walnut pollen. A circled dot marks a molecular component: one purified protein, such as Bet v 1 from birch.
Components are why one source can have several rows. Birch is measured through Bet v 1, Bet v 6 and Bet v 7, the European house dust mite through eight components from Der p 1 to Der p 23. The codes come from the Latin name: Bet v for Betula verrucosa, Der p for Dermatophagoides pteronyssinus.
Allergen families
Allergenfamilie
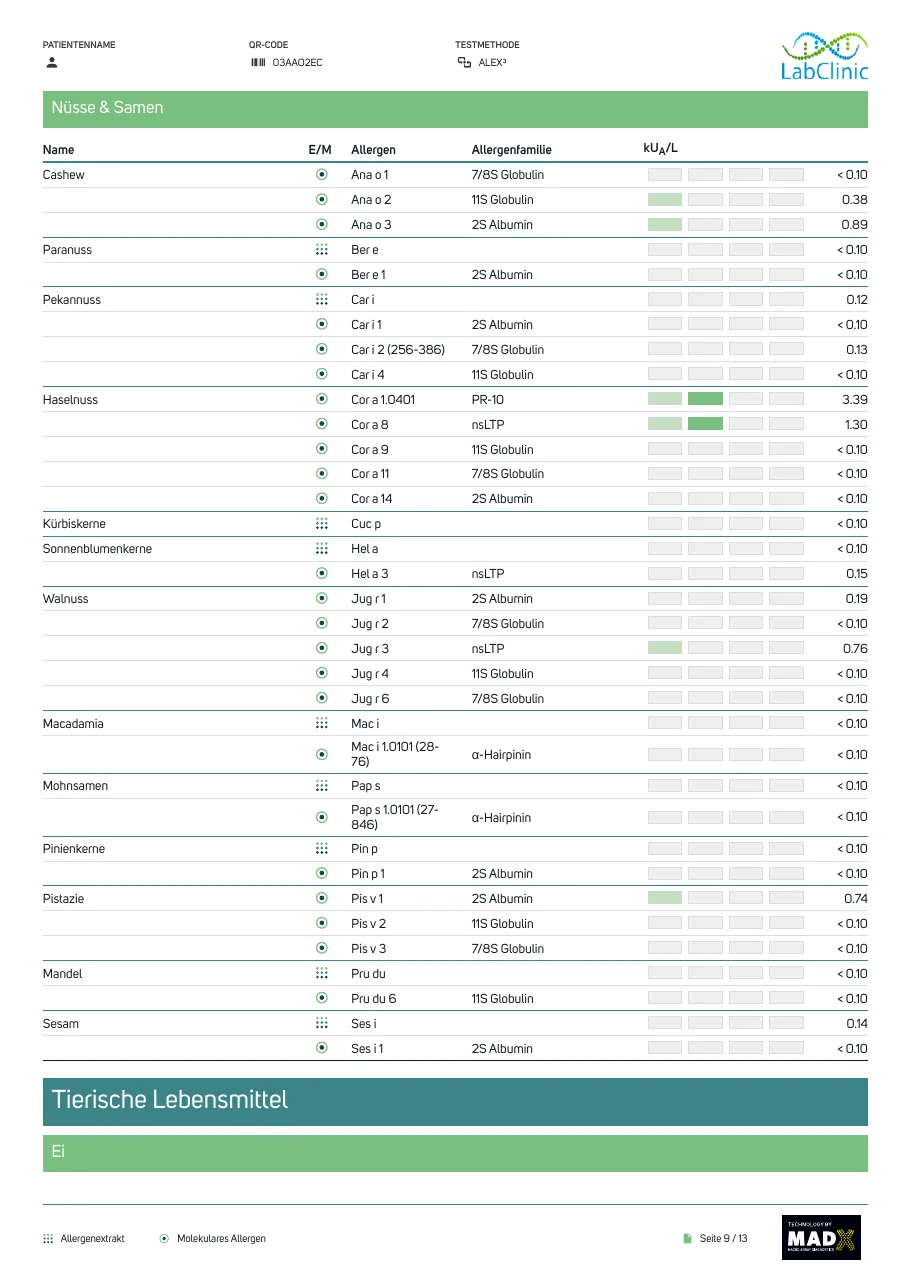
Proteins from different sources can look alike to the immune system. The family column groups them, which helps a doctor tell a primary sensitisation from a cross-reaction. The families you'll meet most often, with values from this sample:
- PR-10: birch Bet v 1 (2.47) and its look-alikes in alder Aln g 1 (1.35), oak Que a 1 (4.39), apple Mal d 1 (1.45) and hazelnut Cor a 1.0401 (3.39).
- Polcalcin and profilin: proteins shared by many pollens, such as alder Aln g 4 (9.24) and timothy grass Phl p 7 (7.71). They can make several pollen results rise together.
- nsLTP: sturdy proteins in fruit, nuts and pollen, such as peach Pru p 3 (1.48) and grape Vit v 1 (5.76).
- Storage proteins (2S albumin, 7/8S and 11S globulin): specific to one food, such as peanut Ara h 2 (0.57) or hazelnut Cor a 14 (below 0.10).
- Tropomyosin: shared by mites, cockroach and shellfish, such as Der p 10 and black tiger prawn Pen m 1 (both below 0.10).
- Parvalbumin: the main fish protein, such as cod Gad m 1 (0.89).
- Lipocalin and uteroglobin: animal proteins, such as cat Fel d 1 (9.85) and dog Can f 1 (6.92).
 (Open full size)
Report page 8
The kUA/L classes
kUA/L
kUA/L stands for kilo-units of allergen-specific IgE per litre. The higher the number, the more IgE in the sample binds to that allergen. The report turns each value into one of five classes, shown by the four-step bar:
- Negative
- below 0.3 kUA/L
- No IgE above the lab's cut-off, or too little to call. The bar stays empty.
- Low
- 0.3 to 1 kUA/L
- A small amount of IgE binds to this allergen.
- Moderate
- 1 to 5 kUA/L
- A clearly measurable amount of IgE.
- High
- 5 to 15 kUA/L
- A large amount of IgE.
- Very high
- above 15 kUA/L
- The top of the lab's scale.
A class describes the amount of IgE measured, not how strongly someone reacts. Many people have Low or even High values without symptoms, and the reverse happens too. A doctor reads the values together with your history.
The interpretation notes
RAVEN² Interpretation Software
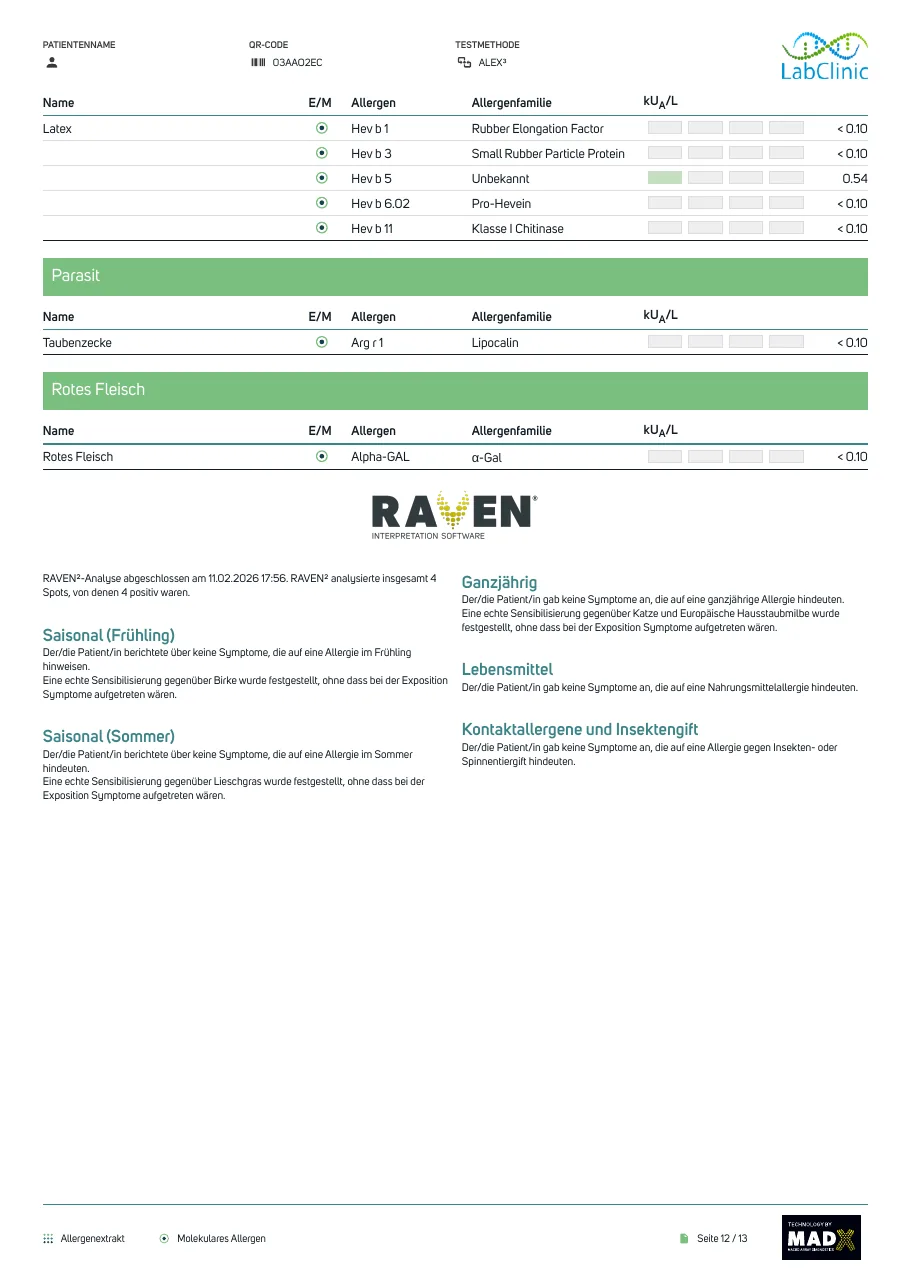
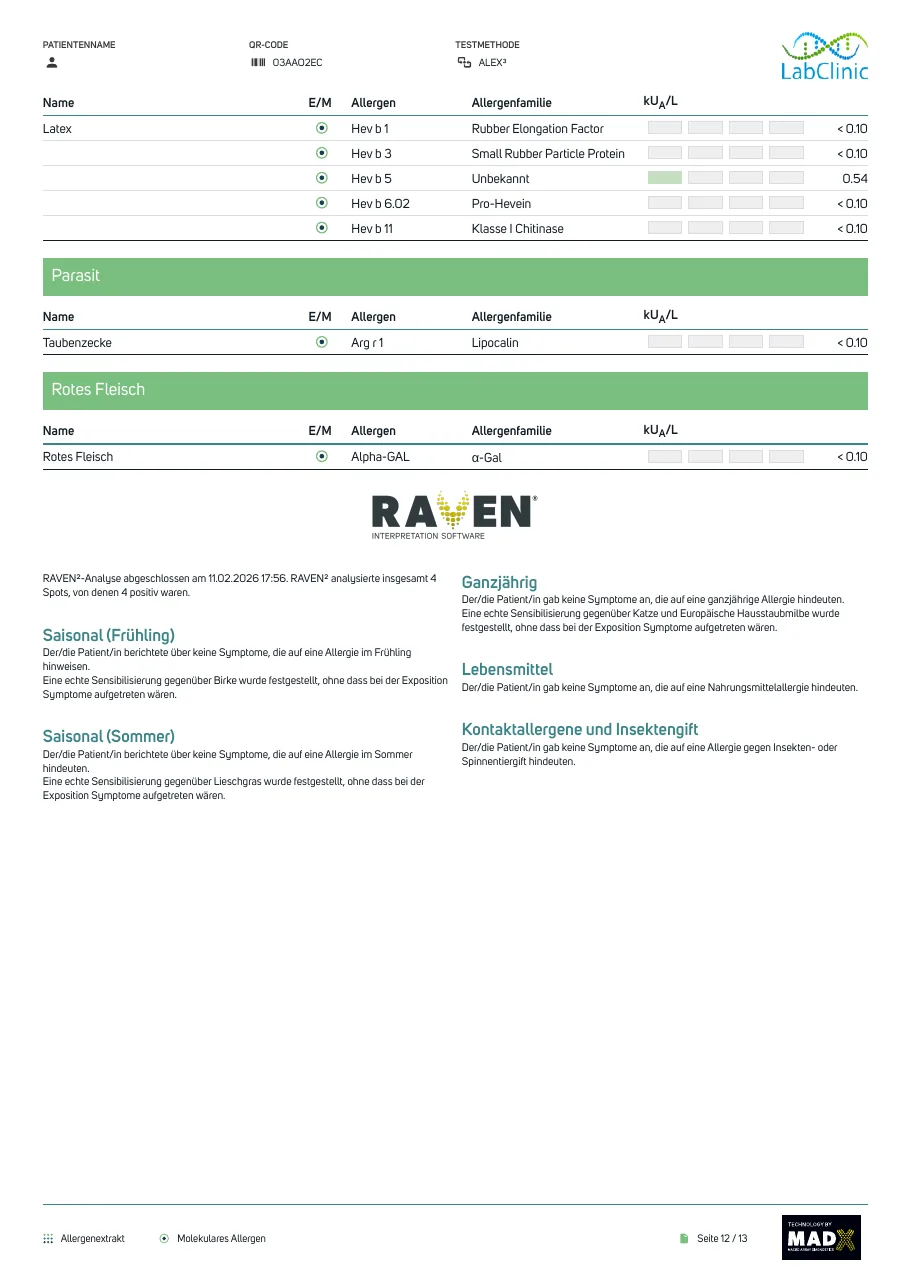
Page 11 holds short notes from RAVEN², the interpretation software that comes with ALEX³. It groups the main findings by spring season, summer season, year-round, food, and contact allergens and insect venom.
The notes combine the results with any symptoms recorded when the sample was taken. None were recorded for this validation sample, so a typical note reads: “Eine echte Sensibilisierung gegenüber Birke wurde festgestellt, ohne dass bei der Exposition Symptome aufgetreten wären.” In English: a genuine sensitisation to birch was found, with no symptoms reported on exposure.
“Genuine” (echt) is the software's word for IgE to a source's own marker proteins rather than a cross-reaction. These notes are software text to support your doctor, not a diagnosis.
 (Open full size)
Report page 11
The sources overview
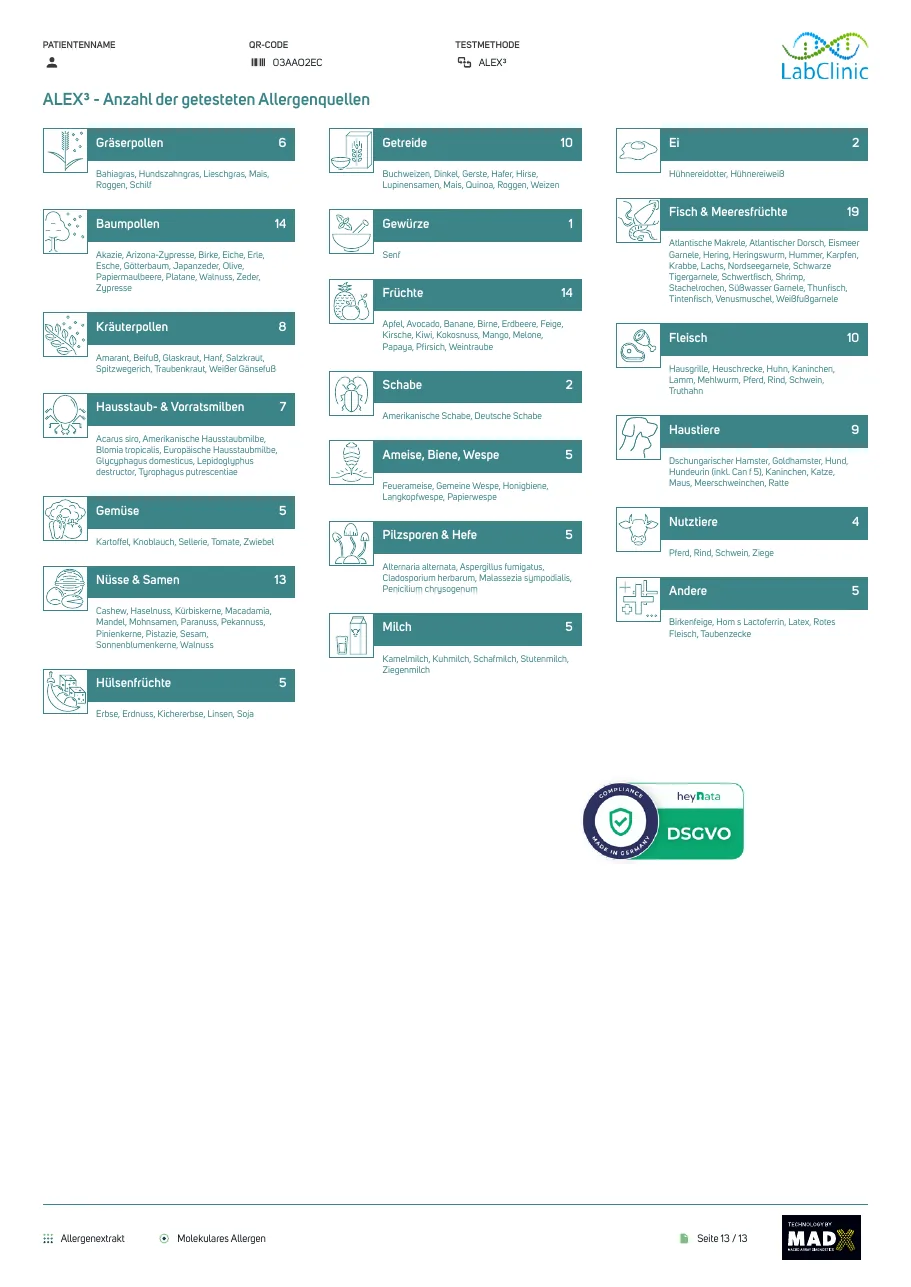
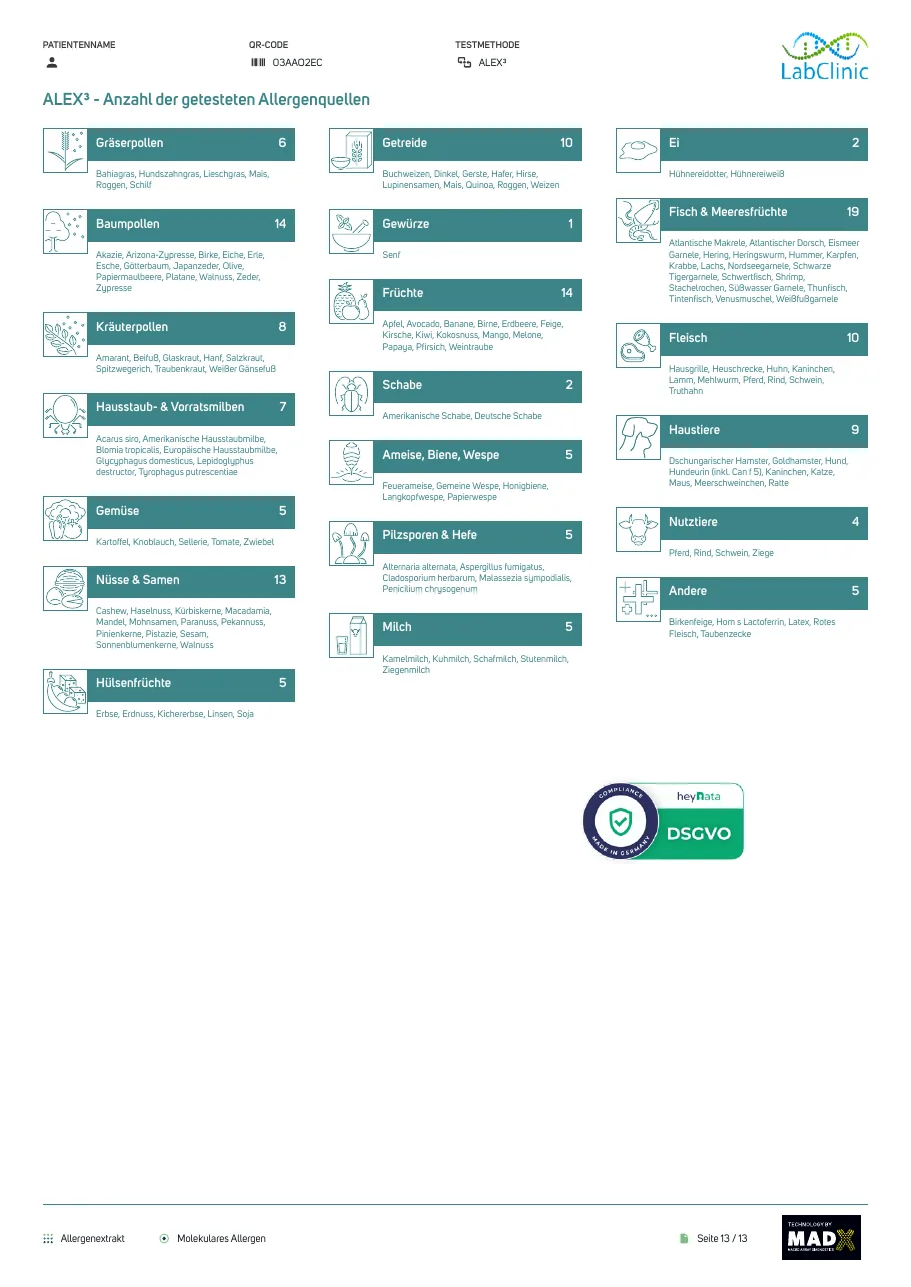
Anzahl der getesteten Allergenquellen
The last page counts the allergen sources tested in each group and names them in German: 14 tree pollens, 6 grasses, 19 fish and seafood, 13 nuts and seeds, 9 pets and so on. It's the quickest way to check that the source you care about was on the panel.
 (Open full size)
Report page 12
German terms on the report
The headings you'll see, in the order they appear.
- Gesamt-IgE
- Total IgE
- Referenzbereich
- Reference range
- Zusammenfassung der nachweisbaren Sensibilisierungen
- Summary of detectable sensitisations
- Baumpollen, Gräserpollen, Kräuterpollen
- Tree pollen, grass pollen, weed pollen
- Hausstaub- & Vorratsmilben
- House dust and storage mites
- Hautschuppen & Epithelien: Haustiere, Nutztiere
- Dander and epithelia: pets, farm animals
- Pilzsporen & Hefe
- Mould spores and yeast
- Insekten: Schabe
- Insects: cockroach
- Gifte: Ameise, Biene, Wespe
- Venoms: ant, bee, wasp
- Pflanzliche Lebensmittel
- Plant foods: fruit, vegetables, grains, spices, legumes, nuts and seeds
- Tierische Lebensmittel
- Animal foods: egg, fish and seafood, meat, milk
- Andere
- Other: CCD, ficus, latex, parasite, red meat (alpha-gal)
- Allergenextrakt
- Allergen extract (E)
- Molekulares Allergen
- Molecular component (M)
- Allergenfamilie
- Allergen family
All 12 pages
Select a page to open it full size.
- (Open full size)
Page 1
- (Open full size)
Page 2
 (Open full size)
Page 3
 (Open full size)
Page 4
 (Open full size)
Page 5
 (Open full size)
Page 6
 (Open full size)
Page 7
- (Open full size)
Page 8
 (Open full size)
Page 9
 (Open full size)
Page 10
- (Open full size)
Page 11
- (Open full size)
Page 12
Your own report, read the same way.
300 allergens from one finger prick at home. Your lab report typically 5 days after the lab receives your sample, and this guide whenever you want it. €300, €1 per allergen.